
A recording for our event, ShipIt! presents Understanding Programs Using Graphs in TruffleRuby, is now available in the ShipIt! Presents section of this page.
You may have heard that a compiler uses a data structure called an abstract-syntax-tree, or AST, when it parses your program, but it’s less common knowledge that an AST is normally used just at the very start of compilation, and a powerful compiler generally uses a more advanced type of data structure as its intermediate representation to optimize your program and translate it to machine code in the later phases of compilation. In the case of TruffleRuby, the just-in-time compiler for Ruby that we’re working on at Shopify, this data structure is something called a sea-of-nodes graph.
I want to show you a little of what this sea-of-nodes graph data structure looks like and how it works, and I think it’s worth doing this for a couple of reasons. First of all, I just think it’s a really interesting and beautiful data structure, but also a practical one. There’s a lot of pressure to learn about data structures and algorithms in order to pass interviews in our industry, and it’s nice to show something really practical that we’re applying here at Shopify. Also, the graphs in sea-of-nodes are just really visually appealing to me and I wanted to share them.
Secondly, knowing just a little about this data structure can give you some pretty deep insights into what your program really means and how the compiler understands it, so I think it can increase your understanding of how your programs run.
I should tell you at this point that I’m afraid I’m actually going to be using Java to show my examples, in order to keep them simpler and easier to understand. This is because compared to Ruby, Java has much simpler semantics—simpler rules for how the language works—and so much simpler graphs. For example, if you index an array in Java that’s pretty much all there is to it, simple indexing. If you index an array in Ruby you could have a positive index, a negative index, a range, conversion, coercion, and lots more—it’s just more complicated. But don’t worry, it’s all super-basic Java code, so you can just pretend it’s pseudo code if you’re coming from Ruby or any other language.
Reading Sea-of-nodes Graphs
Lets dive straight in by showing some code and the corresponding sea-of-nodes graph.
Here’s a Java method. As I said, it’s not using any advanced Java features so you can just pretend it’s pseudo code if you want to. It returns a number from a mathematical sequence known as the Fibonacci sequence, using a simple recursive approach.
Here’s the traditional AST data structure for this program. It’s a tree, and it directly maps to the textual source code, adding and removing nothing. To run it you’d follow a path in the tree, starting at the top and moving through it depth-first.

Abstract syntax tree for the Fibonacci sequence program
And here’s the sea-of-nodes graph for the same program. This is a real dump of the data structure as used in practice to compile the Java method for the Fibonacci sequence we showed earlier.

Sea-of-nodes graph for the Fibonacci sequence program
There’s quite a lot going on here, but I’ll break it down.
We’ve got boxes and arrows, so it’s like a flowchart. The boxes are operations, and the arrows are connections between operations. An operation can only run after all the operations with arrows into it have run.
A really important concept is that there are two main kinds of arrows that are very different. Thick red arrows show how the control flows in your program. Thin green arrows show how the data flows in your program. The dashed black arrows are meta-information. Some people draw the green arrows pointing upwards, but in our team we think it’s simpler to show data flowing downwards.
There are also two major kinds of boxes for operations. Square red boxes do something; they have a side-effect or are imperative in some way. Diamond green boxes compute something (they’re pure, or side-effect free), and green for safe to execute whenever.
P(0) means parameter 0, or the first parameter. C(2) means a constant value of 2. Most of the other nodes should be understandable from their labels. Each node has a number for easy reference.
To run the program in your head, start at the Start node at the top and move down thick red arrows towards one of the Return nodes at the bottom. If your square red box has an arrow into it from an oval or diamond green box, then you run that green box, and any other green boxes pointing into that green box, first.
Here’s one major thing that I think is really great about this data structure. The red parts are an imperative program, and the green parts are mini functional programs. We’ve separated the two out of the single Java program. They’re joined where it matters, and not where it doesn’t. This will get useful later on.
Understanding Through Graphs
I said that I think you can learn some insights about your program using these graphs. Here’s what I mean by that.
When you write a program in text, you’re writing in a linear format that implies lots of things that aren’t really there. When we get the program into a graph format, we can encode only the actual precise rules of the language and relax everything else.
I know that’s a bit abstract, so here’s a concrete example.
Based on a three-way if-statement it does some arithmetic. Notice that b * c is common to two of the three branches.

Sea-of-nodes graph for a three-way if-statement-program
When we look at the graph for this we can see a really clear division between the imperative parts of the program and the functional parts. Notice in particular that there is only one multiplication operation. The value of a * b is the same on whichever branch you compute it, so we have just one value node in the graph to compute it. It doesn’t matter that it appeared twice in the textual source code—it has been de-duplicated by a process known as global value numbering. Also, the multiplication node isn’t fixed in either of the branches, because it’s a functional operation and it could happen at any point and it makes no change to what the program achieves.
When you look at the source code you think that you pick a branch and only then you may execute a * b, but looking at the graph we can see that the computation a * b is really free from which branch you pick. You can run it before the branch if you want to, and then just ignore it if you take the branch which doesn’t need it. Maybe doing that produces smaller machine code because you only have the code for the multiplication once, and maybe it’s faster to do the multiplication before the branch because your processor can then be busy doing the multiplication while it decides which branch to go to.
As long as the multiplication node’s result is ready when we need it, we’re free to put it wherever we want it.
You may look at the original code and say that you could refactor it to have the common expression pulled out in a local variable. We can see here that doing that makes no difference to how the compiler understands the code. It may still be worth it for readability, but the compiler sees through your variable names and moves the expression to where it thinks it makes sense. We would say that it floats the expression.
Graphs With Loops
Here’s another example. This one has a loop.
It adds the parameter a to an accumulator n times.
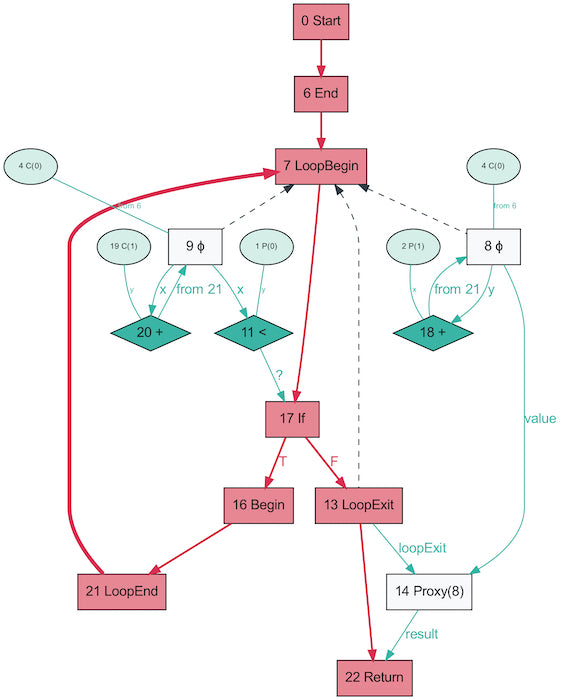
Sea-of-nodes graph for a program with loops
This graph has something new, an extra thick red arrow backward now. That closes the loop, it’s the jump back to the start of the loop for a new iteration.
The program is written in an imperative way, with a traditional iterative looping construct as you’d use in C, but if we look at the little isolated functional part, we can see the repeated addition on its own very clearly. There’s literally a little loop showing that the + 1 operation runs repeatedly on its own result.

Isolated functional part of sea-of-nodes graph
That phi node (the little circle with the line in it is a Greek letter) is a slightly complicated concept with a traditional name. It means that the value at that point may be one of multiple possibilities.
Should We Program Using Graphs?
Every few years someone writes a new PhD thesis on how we should all be programming graphically instead of using text. I think you can possibly see the potential benefits and the practical drawbacks of doing that by looking at these graphs.
One benefit is that you’re free to reshape, restructure, and optimize your program by manipulating the graph. As long as you maintain a set of rules, the rules for the language you’re compiling, you can do whatever you want.
A drawback is that it’s not exactly compact. This is a 6 line method but it’s a full-screen to draw it as a graph, and it already has 21 nodes and 22 arrows in it. As we get bigger graphs it becomes impossible to draw them without the arrows starting to cross and they become so long that they have no context—you can’t see where they’re going to or coming from, and then it becomes much harder to understand.
Using Sea-of-nodes Graphs at Shopify
At Shopify we’re working on ways to understand these graphs at Shopify-scale. The graphs for idiomatic Ruby code in a codebase like our Storefront Renderer can get very large and very complicated—for example this is the Ruby equivalent to the Java Fibonacci example.

Sea-of-nodes graph for the Java Fibonacci example in Ruby (click for larger SVG version)
One tool we’re building is the program to draw these graphs that I’ve been showing you. It takes compiler debug dumps and produces these illustrations. We’re also working on a tool to decompile the graphs back to Ruby code, so that we can understand how Ruby code is optimized, by printing the optimized Ruby code. That means that developers who just know Ruby can use Ruby to understand what the compiler is doing.
Summary
In summary, this sea-of-nodes graph data structure allows us to represent a program in a way that relaxes what doesn’t matter and encodes the underlying connections between parts of the program. The compiler uses it to optimize your program. You may think of your program as a linear sequence of instructions, but really your compiler is able to see through that to something simpler and more pure, and in TruffleRuby it does that using sea-of-nodes.
Sea-of-nodes graphs are an interesting and, for most people, novel way to look at your program.
Additional Information
- A simple graph-based intermediate representation, Cliff Click, Michael Paleczny, 1995
- An intermediate representation for speculative optimizations in a dynamic compiler, Gilles Duboscq, Thomas Würthinger, Lukas Stadler, Christian Wimmer, Doug Simon, Hanspeter Mössenböck, 2013
ShipIt! Presents: Understanding Programs Using Graphs in TruffleRuby
Watch Chris Seaton and learn about TruffleRuby’s sea-of-nodes. This beautiful data structure can reveal surprising in-depth insights into your program.
If this sounds like the kind of problems you'd enjoy solving, come work for us. Check out the Software Development at Shopify (Expression of Interest) career posting and apply specifying an interest in Developer Acceleration.