
In this article, I’ll look at:
- how to interpret flame graphs generated by the Shopify Theme Inspector
- what kind of flame graphs generate from unoptimized Liquid code patterns
- tips for spotting and avoiding these performance issues.
Install the Shopify Theme Inspector
With a Google Chrome browser, install the Shopify Theme Inspector extension. Follow this article on Debug Liquid Render Performance with Shopify Theme Inspector for Chrome for how to start with the extension and get to a point where you can produce a flame graph on your store.
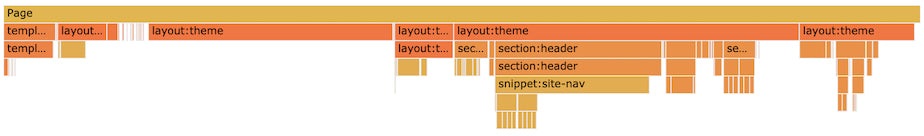
A flame graph example
The flame graph produced by this tool is a data representation of the code path and the time it took to execute. With this tool, as a developer, you can find out how long a piece of code took to render.
Start with Clean Code
We often forget what a clean implementation looks like, and this is often how we, Shopify, envision this piece of liquid code will be used—it’s often not the reality as developers will find their own ways to achieve their goals. As time passes, code becomes complicated. We need to go back to the clean implementation to understand what makes it take the time to render.
The simple code above creates a flame graph that looks like this image below:
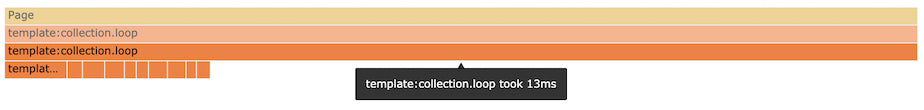
Flame graph for a 10 item paginated collection
The template section took 13 ms to complete rendering. Let’s have a better understanding of what we are seeing here.

Highlighted flame graph for a 10 item paginated collection
The area where the server took the time to render is where the code for the pagination loop is executed. In this case, we rendered 10 product titles. Then there’s a block of time that seems to disappear. It‘s actually the time spent on Shopify’s side collecting all the information that belongs to the products in the paginate collection.
Look at Inefficient Code
To know what’s an inefficient code, one must know what it looks like, why it is slow, and how to recognize it in the flame graph. This section walks through a side-by-side comparison of code and it’s flame graphs, and how a simple change results in bad performance.
Heavy Loop
Let’s take that clean code example and make it heavy.
What I’ve done here is accessed attributes in a product while iterating through a collection. Here’s the corresponding flame graph:
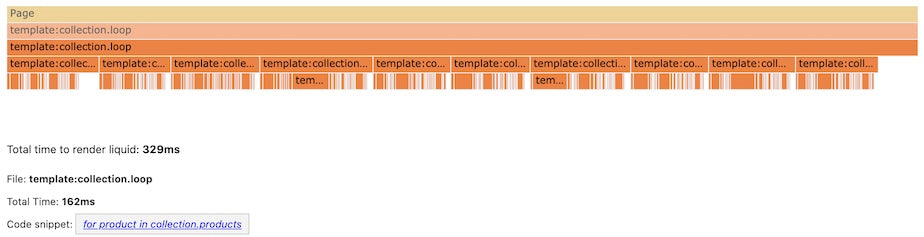
Flame graph for a 10 item paginated collection with accessing to its attributes
The total render time of this loop is now at 162 ms compared to 13 ms from the clean example. The product attributes access changes a less than 1 ms render time per tile to a 16 ms render time per tile. This produces exactly the same markup as the clean example but at the cost of 16 times more rendering time. If we increase the number of products to paginate from 10 to 50, it takes 800 ms to render.
Tips:
- Instead of focusing on how many 1 ms bars there are, focus on the total rendering time of each loop iteration
- Clean up any attributes aren’t being used
- Reduce the number of products in a paginated page (Potentially AJAX the next page of products)
- Simplify the functionality of the rendered product
Nested Loops
Let’s take that clean code example and make it render with nested loops.
This code snippet is a typical example of iterating through the options and variations of a product. Here’s the corresponding flame graph:
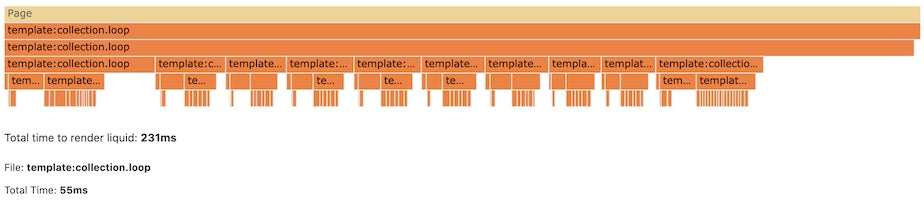
Flame graph for two nested loop example
This code snippet is a two-level nested loop rendering at 55 ms.
Nested loops are hard to notice when just looking at code because it’s separated by files. With the flame graph, we see the flame graph start to grow deeper.
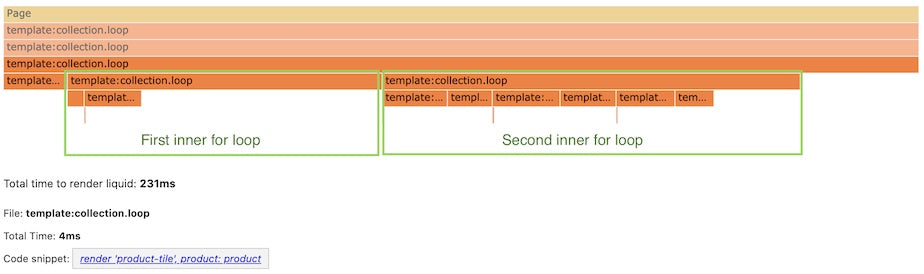
Flame graph of a single loop on a product
As highlighted in the above screenshot, the two inner for-loops stacks side by side. This is okay if there are only one or two loops. However, each iteration rendering time will vary based on how many inner iterations it has.
Let’s look at what a three nested loop looks like.
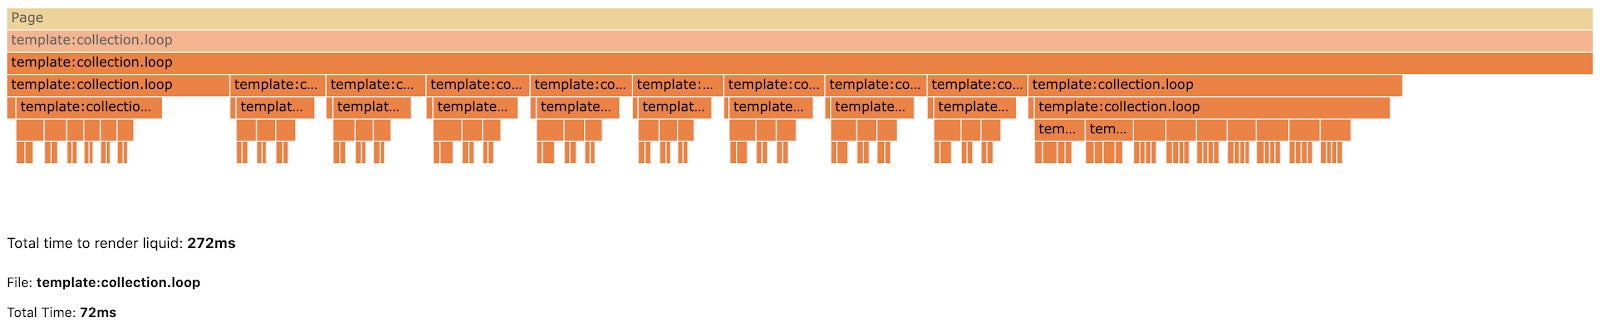
Flame graph for three nested loop example
This three level nested loop rendered at 72 ms. This can get out of hand really quickly if we aren’t careful. A small addition to the code inside the loop could blow your budget on server rendering time.
Tips:
- Look for a sawtooth shaped flame graph to target potential performance problem
- Evaluate each flame graph layer and see if the nested loops are required
Mix Usage of Multiple Global Liquid Scope
Let’s now take that clean code example and add another global scoped liquid variable.
And here’s the corresponding flame graph:
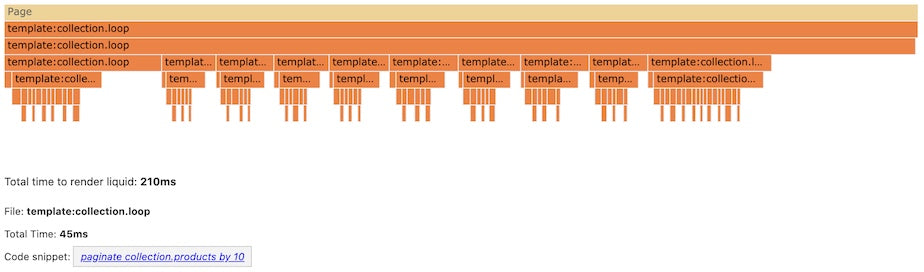
Flame graph of when there’s one item in the cart with rendering time at 45 ms
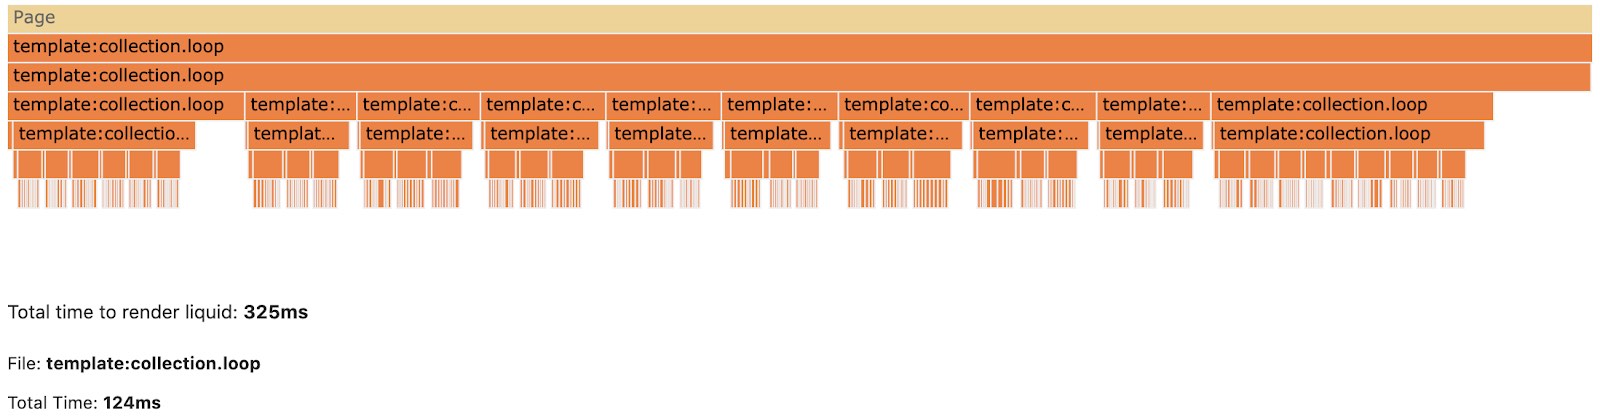
Flame graph of when there’s 10 items in the cart with rendering time at 124 ms
This flame graph is an example of a badly nested loop where each variation is accessing the cart items. As more items are added to the cart, the page takes longer to render.
Tips:
- Look for hair comb or sawtooth shaped flame graph to target potential performance problem
- Compare flame graphs between one item and multiple items in cart
- Don’t mix global liquid variable usage. If you have to, use AJAX to fetch for cart items instead
What is Fast Enough?
Try to aim for 200 ms but no more than 500 ms total page rendering time reported by the extension. We didn’t just pick a number out of the hat. It’s made with careful consideration of what other allocation of available time during a page render that we need to include to hit a performance goal. Google Web Vitals stated that a good score for Largest Content Paint (LCP) is less than 2.5 seconds. However, the largest content paint is dependent on many other metrics like time to first byte (TTFB) and first content paint (FCP). So, let’s make some time allocation! Also, let’s understand what each metric represents:

- From Shopify’s server to a browser is the network overhead time required. It varies based on the network the browser is on. For example, navigating your store on 3G or Wi-Fi.
- From a browser blank page (TTFB) to showing anything (FCP) is the time the browser needs to read and display the page.
- From the FCP to the LCF is the time the browser needs to get all other resources (images, css, fonts, scripts, video, … etc.) to complete the page.
The goal is an LCP < 2.5 seconds to receive a good score
|
Server → Browser |
300 ms for network overhead |
|
Browser → FCP |
200 ms for browser to do its work |
|
FCP → LCP |
1.5 sec for above the fold image and assets to download |
Which leaves us 500 ms for total page render time.
Does this mean that as long as we keep server rendering below 500 ms, we can get a good LCP score? No, there’s other considerations like critical rendering path that aren’t addressed here, but we’re at least half way there.
Tip:
- Optimizing for critical rendering path on the theme level can bring the 200 ms requirement between the browser to FCP timing down to a lower number.
So, we have 500 ms for total page render time, but this doesn’t mean you have all 500 ms to spare. There’s some mandatory server render times that are dedicated to Shopify and others that the theme dedicates to rendering global sections like the header and footer. Depending how you want to allocate the rendering resources, the available rendering time you leave yourself for the page content varies. For example:
|
Total |
500 ms |
|
Shopify (content for header) |
50 ms |
|
Header (with menu) |
100 ms |
|
Footer |
25 ms |
|
Cart |
25 ms |
|
Page Content |
300 ms |
I mentioned trying to aim for 200 ms total page rendering time—this is a stretch goal. By keeping ourselves mindful of a goal, it’s much easier to start recognizing when performance starts to degrade.
An Invitation to the Shopify Theme Developer Community
We couldn’t possibly know every possible combination of how the world is using Shopify. So, I invite you to share your experience with Shopify’s Theme Inspector and let us know how we can improve at https://github.com/Shopify/shopify-theme-inspector/issues/41 or tweet us at @shopifydevs.
Wherever you are, your next journey starts here! If building systems from the ground up to solve real-world problems interests you, our Engineering blog has stories about other challenges we have encountered. Intrigued? Visit our Engineering career page to find out about our open positions and learn about Digital by Default.